The Team Report gives sales managers visibility into individual rep performance, territory distribution, and coaching opportunities. This article explains the Team Leaderboard, covering confirmed revenue per rep, active customer rates, quote conversion, and largest order, along with how to use territory filters and identify over- or under-served regions.
Platform: WizOrder | Who is this for: Admins & Sales Managers
To Get There: Reports > Team
Table of Contents
| Sections | Topics |
| A | View Rep Performance Table |
| B | Identify Coaching Opportunities |
| C | Analyse Territory Distribution |
| D | Filter the Team Report |
| E | Export the Team Report |
| F | FAQs |
Before You Begin
- Ensure you have access to the Reports section in WizOrder.
- All metrics update in real time as you apply filters — changing the date range, rep, or territory filter immediately recalculates all data on the page.
A. View Rep Performance Table
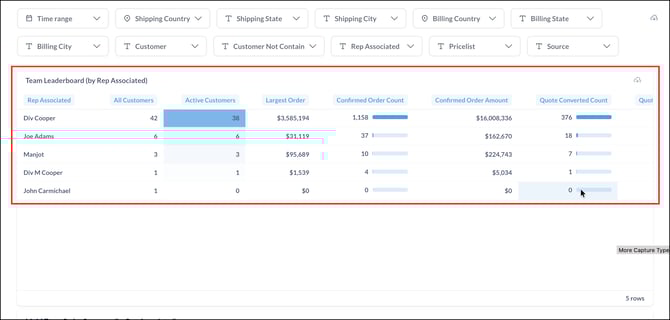
The Team Leaderboard ranks every sales rep on your team and shows their performance side by side. Use it to see who is actively selling, how much revenue each rep is generating, and how well they are converting quotes into confirmed orders.
The Leaderboard Table
Each row represents one sales rep. The columns show:
- Rep Associated: The name of the sales rep
- All Customers: Total number of customers assigned to that rep
- Active Customers: Customers who placed orders in the selected period. Shown with a blue bar — the darker and longer the bar, the higher the active customer count relative to the rest of the team.
- Largest Order: The single highest-value order placed by any of their customers in the selected period
- Confirmed Order Count: Total confirmed orders, with a visual bar for quick comparison across reps
- Confirmed Order Amount: Total revenue from confirmed orders
- Quote Converted Count: How many quotes the rep successfully converted into orders
The total number of reps shown appears at the bottom right of the table.
B. Identify Coaching Opportunities
Use the Team Report to spot patterns that show where a rep may need support:
- High Activity / Low Revenue: The rep is active but not converting. They may need help with account management or pricing conversations.
- Declining Trends: Revenue dropping month-over-month could indicate a customer retention issue worth investigating.
- Low Average Order Value vs. Peers: The rep may benefit from cross-selling training or guidance on volume-based pricing.
C. Analyse Territory Distribution
Use the filters at the top of the page to narrow the leaderboard to a specific region. For example, selecting two states under Shipping State updates the table instantly — showing only the reps and customers tied to those locations.
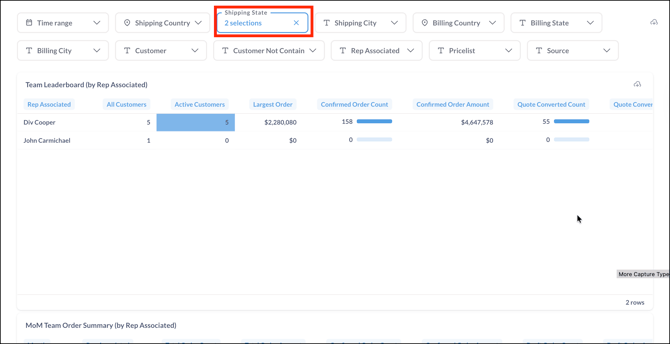
When a filter is active, it is highlighted in blue and shows the number of selections applied. To remove it, click the X next to the filter.
Use this view to spot territory imbalances across your team:
- Over-served territories: Multiple reps showing strong numbers in the same region may indicate overlap. Consider redistributing coverage to unlock capacity elsewhere.
- Under-served territories: A region with available customers but low order volume signals an opportunity worth exploring — whether that's reassigning a rep or increasing outreach in that area.
D. Filter the Team Report
Use the available filters to narrow down your data:
- Date Range: Select a predefined period or set a custom date range
- Sales Representative: Filter by a specific rep
- Region or Territory: Narrow data by geographic area
- Market Tag: Filter by market segment or tag
All metrics update in real time as you apply filters. To learn more about how to use filters on your reports, see the Reports Dashboard & Navigation article.
E. Export the Team Report
- Click the Export button to download a PDF of the Team Report.
The downloaded file includes the performance table, charts, and all applied filters.
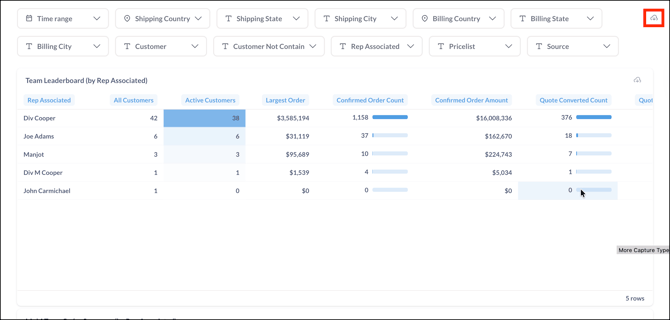
Note: To download a specific section, click the download icon at the top right of that table.
FAQs
1. What does Active Customers mean in the Team Leaderboard?
A. Active Customers refers to the customers assigned to a rep who placed at least one confirmed order in the selected time period. It is different from All Customers, which shows the total number of customers assigned to the rep regardless of activity.
2. How do I use the Team Report to identify territory imbalances?
A. Apply the Shipping State filter to narrow the leaderboard to a specific region. Look for over-served territories where multiple reps overlap, or under-served territories where order volume is low despite available customers. Adjust rep assignments or outreach accordingly.
3. Can I download the Team Report for a specific sales rep or time period?
A. Yes. Apply your preferred filters — such as date range and sales rep — first, then click Export. The downloaded PDF reflects all applied filters including the selected rep and time period.
Not finding what you need? Browse the WizCommerce Help Center, reach out to your Customer Success Manager, or contact our Support Team.